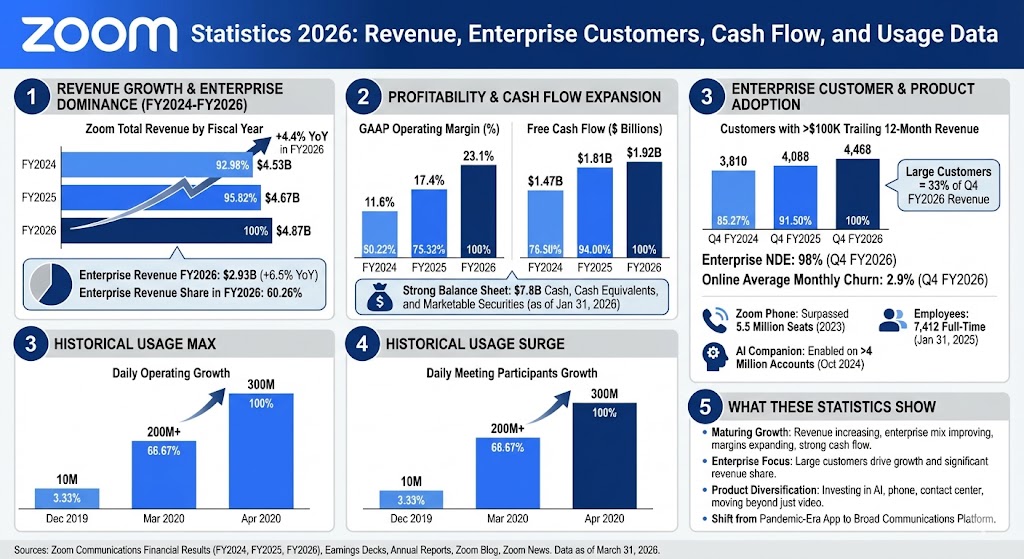
Zoom reported $4.8688 billion in total revenue for fiscal year 2026, up 4.4% year over year.
Enterprise revenue reached $2.9341 billion in fiscal year 2026, up 6.5% year over year.
Enterprise revenue accounted for about 60.26% of total fiscal year 2026 revenue.
GAAP operating margin improved from 11.6% in fiscal year 2024 to 17.4% in fiscal year 2025 and 23.1% in fiscal year 2026.
Free cash flow rose from $1.4719 billion in fiscal year 2024 to $1.9241 billion in fiscal year 2026.
Cash, cash equivalents, and marketable securities totaled $7.8 billion as of January 31, 2026.
Zoom had 4,468 customers contributing more than $100,000 in trailing-12-month revenue at the end of Q4 fiscal year 2026.
Those $100,000-plus customers represented 33% of Q4 fiscal year 2026 revenue in Zoom’s investor deck.
Zoom’s trailing 12-month net dollar expansion rate for enterprise customers was 98% in Q4 fiscal year 2026.
Online average monthly churn was 2.9% in Q4 fiscal year 2026.
AI Companion had been enabled on more than 4 million accounts by October 2024.
Zoom had 7,412 full-time employees as of January 31, 2025.
Zoom Phone surpassed 5.5 million seats in 2023.
Zoom’s daily meeting participants increased from a peak of 10 million in December 2019 to more than 200 million in March 2020 and 300 million in April 2020.
Zoom Revenue Statistics
Zoom’s revenue has continued to expand at a moderate pace since fiscal year 2024, with enterprise revenue growing faster than the overall business. That mix shift matters because it shows Zoom is leaning more heavily on larger organizational accounts rather than only its self-serve online business.
Zoom total revenue by fiscal year
Label
Bar
Value
FY2024
$4.53B
FY2025
$4.67B
FY2026
$4.87B
Max = $4.87B. Widths: FY2024 92.98%, FY2025 95.82%, FY2026 100.00%
Zoom’s enterprise revenue rose from $2.6193 billion in fiscal year 2024 to $2.7542 billion in fiscal year 2025 and $2.9341 billion in fiscal year 2026. Based on those totals, enterprise revenue represented about 57.86% of revenue in fiscal year 2024, 59.03% in fiscal year 2025, and 60.26% in fiscal year 2026.
Zoom Profitability and Cash Flow Statistics
One of the clearest themes in Zoom’s recent numbers is margin expansion. Revenue growth has been steady rather than explosive, but operating leverage and cash generation have improved meaningfully.
Zoom GAAP operating margin by fiscal year
Label
Bar
Value
FY2024
11.6%
FY2025
17.4%
FY2026
23.1%
Max = 23.1%. Widths: FY2024 50.22%, FY2025 75.32%, FY2026 100.00%
Zoom free cash flow by fiscal year
Label
Bar
Value
FY2024
$1.47B
FY2025
$1.81B
FY2026
$1.92B
Max = $1.92B. Widths: FY2024 76.50%, FY2025 94.00%, FY2026 100.00%
Zoom also ended fiscal year 2026 with $7.8 billion in cash, cash equivalents, and marketable securities, showing that the company still has a very strong balance sheet even as it continues repurchasing stock and investing in product development.
Zoom Enterprise Customer Statistics
Zoom’s larger accounts remain central to the company’s growth story. The count of customers contributing more than $100,000 in trailing-12-month revenue has kept rising, and those customers represented one-third of quarterly revenue in the latest investor deck.
Customers contributing more than $100,000 in trailing-12-month revenue
In Q4 fiscal year 2026, Zoom also reported a 98% trailing 12-month net dollar expansion rate for enterprise customers and online average monthly churn of 2.9%. Those figures suggest the business is still retaining customers well, even if expansion within large accounts is now much steadier than during the pandemic surge.
Zoom Usage and Product Adoption Statistics
The historical figures below refer to daily meeting participants, not unique daily active users. They still show how quickly Zoom scaled during the pandemic and how large the platform became in a very short period.
Zoom daily meeting participants growth
Label
Bar
Value
Dec 2019
10M
Mar 2020
200M+
Apr 2020
300M
Max = 300M. Widths: Dec 2019 3.33%, Mar 2020 66.67%, Apr 2020 100.00%
Zoom’s more recent product-adoption milestones also show how the company has evolved beyond meetings. Zoom said AI Companion had been enabled on more than 4 million accounts by October 2024, while Zoom Phone had surpassed 5.5 million seats in 2023. Zoom also reported 7,412 full-time employees as of January 31, 2025.
What These Zoom Statistics Show
These Zoom statistics show a company that is no longer defined only by pandemic-era meeting growth. Revenue is still increasing, enterprise mix is improving, margins are expanding, and free cash flow remains strong. That combination gives Zoom room to invest in AI, phone, contact center, and workplace products while still preserving strong profitability.
The numbers also show that Zoom is becoming more enterprise-oriented. Large-customer counts keep rising, enterprise revenue is growing faster than company-wide revenue, and the company continues to generate a significant share of sales from bigger accounts. In practical terms, Zoom now looks more like a broad communications and productivity platform than a single-purpose video app.
Sources
Zoom Communications Reports Fourth Quarter and Fiscal Year 2026 Financial Results, February 25, 2026
Zoom Communications Reports Fourth Quarter and Fiscal Year 2025 Financial Results, February 24, 2025
Zoom Video Communications Reports Fourth Quarter and Fiscal Year 2024 Financial Results, February 26, 2024
Zoom Q4 FY26 Earnings Deck, February 25, 2026
Zoom Communications 2025 Annual Report and Form 10-K
Zoom News, AI Companion 2.0 announcement, October 9, 2024
Zoom Blog, A Year Later: Reflecting and Looking Ahead, March 17, 2021
Zoom Blog, A Message to Our Users, April 1, 2020
Zoom Blog, Unified License with Access from the Department of Telecommunications in India
Optimize your office navigation with our top 10 directional signage stands—discover which options will transform your workspace into a navigational haven.